Table of Contents
Reporting is a critical part to any SEO campaign, especially if you’re an agency working with clients.
A good SEO report allows you to set a baseline, track performance and progress over the life of the campaign.
We went through dozens of SEP reporting tools before we decided to build our own SEO reporting template using Google Looker Studio.
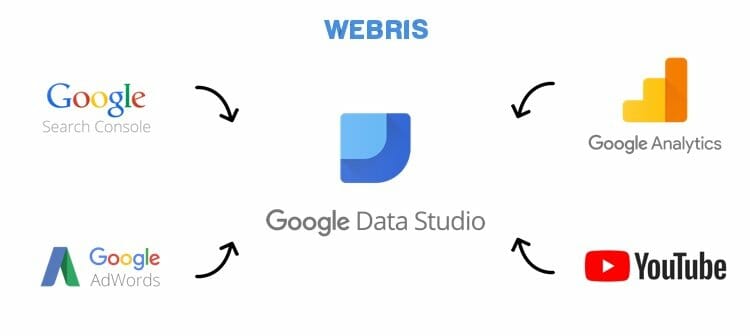
1. Connection to Google properties
Looker has built in connections to pull from all of the data sources you need to build a proper SEO report. Simply build the visual dashboard for how you want it to look and pull through key data with a few clicks.
2. Connection to non-Google properties
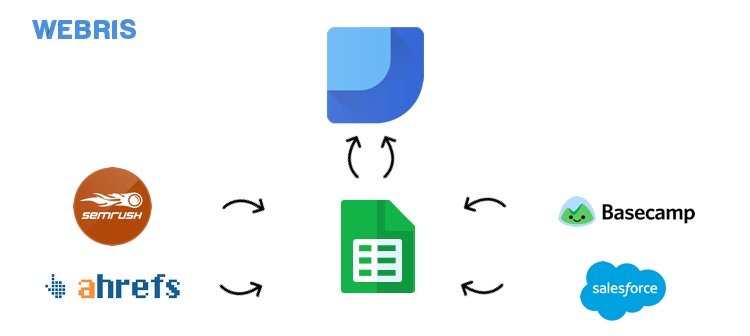
You can export data from other tools in Google Sheets (i.e. keyword rank tracking, project management info, CRM data, etc) and push into Looker. In other words, you can pull data from everywhere and format it into a branded, automated SEO reporting template.
3. The reporting is free to use
Looker does offer paid packages, but to build the SEO reporting you need for clients, the free version works perfect.

If you’ve never used Looker before, watch this video for a beginner’s crash course on report building.
Access The FREE SEO Reporting Template
The rest of this post will break down the the SEO reporting template our agency uses for all of our clients. If you want access to it, you can grab it here for free.
Once you sign up, you will be redirected to our learning platform where you will find an entire suite of free templates and trainings for SEO agencies.
1. Summary page
Why include this page?
- Provides a Snapshot: Quickly offers a high-level overview of key metrics and performance indicators for stakeholders.
- Facilitates Decision-Making: Enables informed decisions by presenting the most critical data at a glance.
- Enhances Report Usability: Helps users navigate through detailed reports by summarizing essential information.
- Improves Clarity: Prevents data overload by condensing complex information into digestible insights.
- Saves Time: Allows stakeholders to quickly grasp the overall SEO performance without delving into every detail.
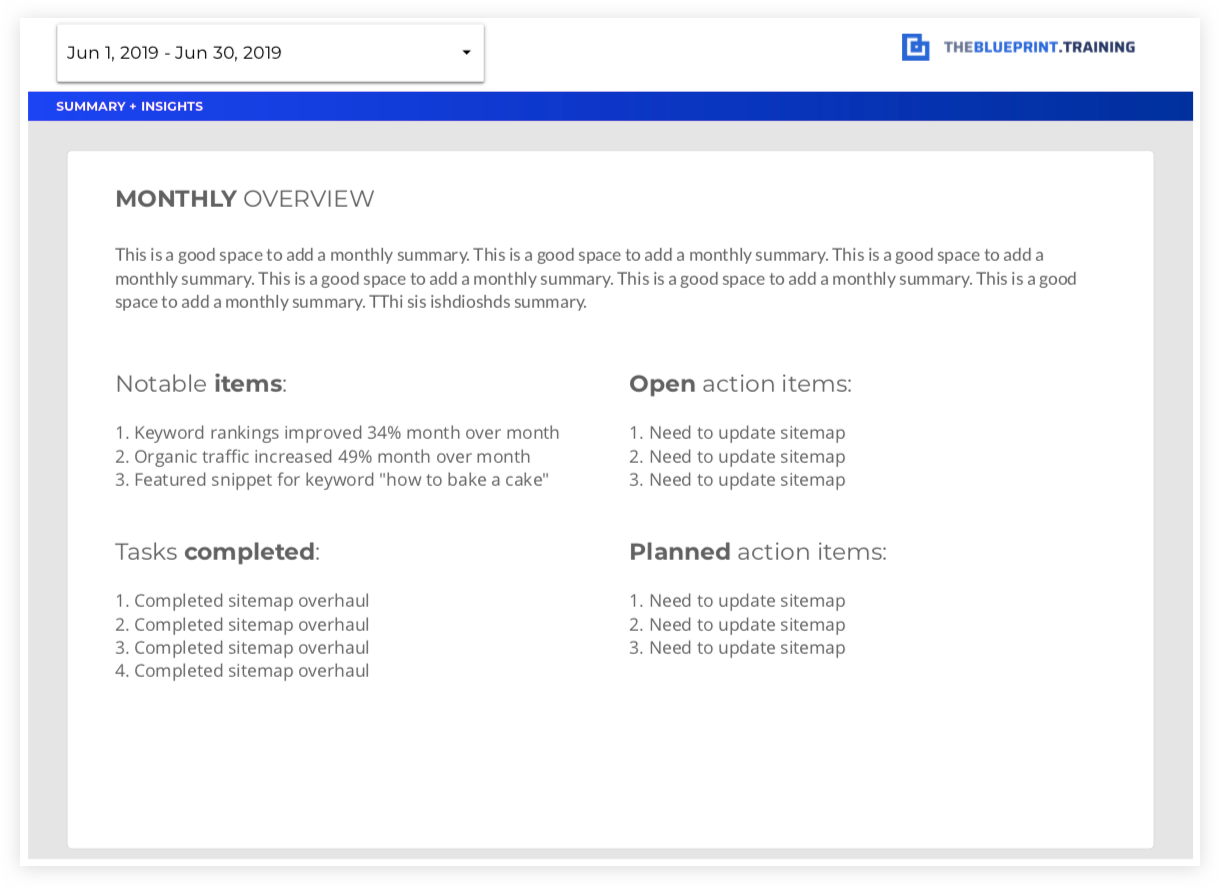
What to include on this page?
- A summary of that reporting period including the main findings / thoughts of the current reporting period.
- Major SEO deliverables completed that reporting period.
- Open action items that require attention (both the agency and the client).
- Summary of increases (or decreases) in organic traffic and additional thoughts.
- Upcoming meetings, tasks, and deliverables to be completed for the following month.
This is a great page to add data from your project management tool. Pull down data into Google Sheets and pull through your updated project plan.
More resources
2. Organic traffic summary report
Why include this page?
- Evaluates SEO Effectiveness: A high-level traffic summary allows you to see organic traffic trends over time. Measures how well your SEO strategies are driving traffic to your site.
- Identifies Growth Opportunities: Helps pinpoint which areas or pages are performing well and where improvements are needed.
- Monitors User Behavior: Analyzes how organic visitors interact with your site, providing insights into user experience and engagement.
- Supports Strategic Planning: Offers data-driven insights for refining content strategies, keyword targeting, and on-page optimizations.
- Justifies SEO Investment: Demonstrates the ROI of SEO efforts by showing tangible results in traffic growth and engagement.
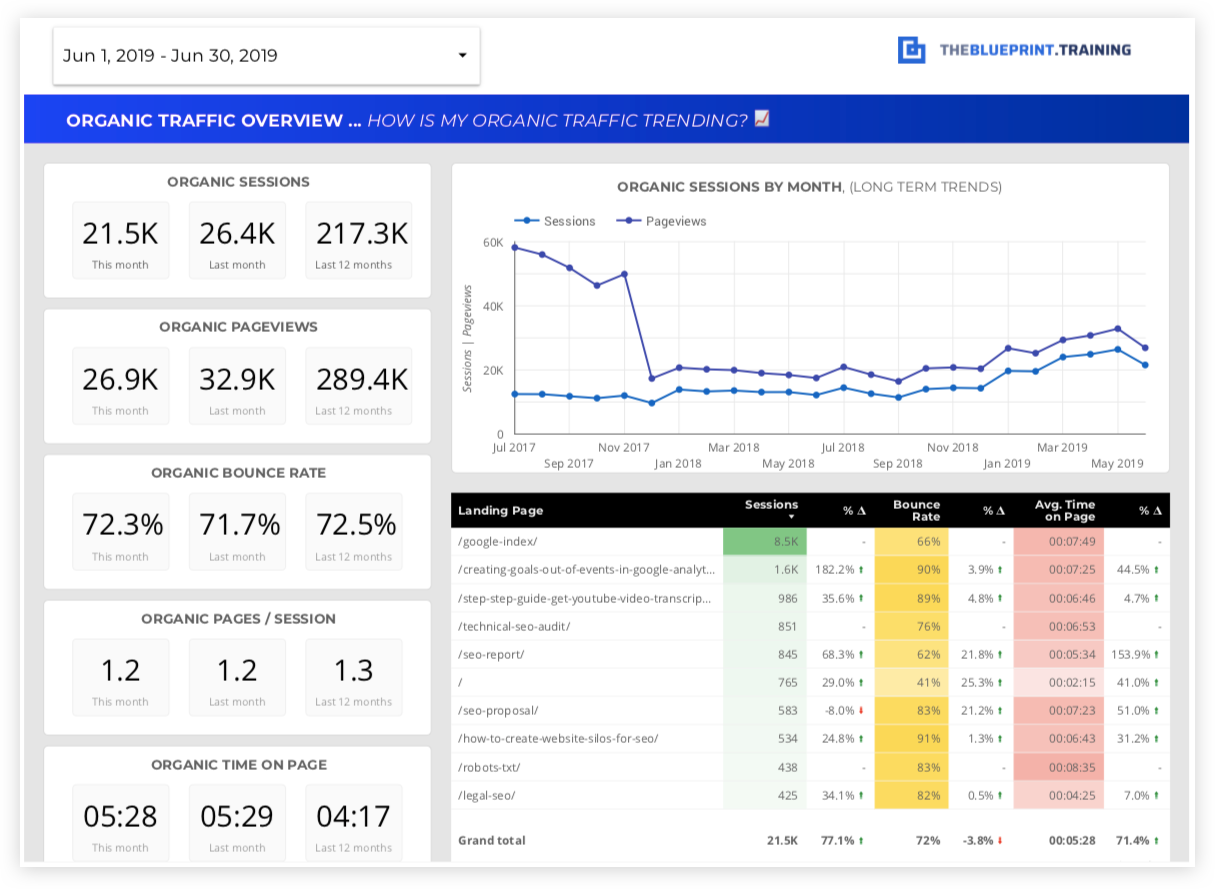
What’s measured on this page?
- Total Organic Sessions: Number of visits from organic search, compared to previous periods.
- Traffic Trends: Monthly or quarterly trends, showing growth or decline in organic traffic.
- Top Traffic-Driving Keywords: List of keywords bringing in the most visitors and their ranking positions.
- Top Landing Pages: Pages that receive the highest amount of organic traffic.\
- User Behavior Metrics: Metrics like bounce rate, average session duration, and pages per session for organic visitors.
- New vs. Returning Visitors: Breakdown of first-time visitors compared to returning ones.
- Geographic Distribution: Regions or countries contributing the most organic traffic.
- Device Breakdown: Traffic segmented by device type (desktop, mobile, tablet).
- Comparative Analysis: Year-over-year or month-over-month comparisons to highlight growth or declines.
- Actionable Insights: Key takeaways and recommendations based on organic traffic performance.
More resources
3. Organic traffic breakdown
Why include this page?
- Granular Insights: Offers detailed understanding of how different segments of organic traffic engage with your website, allowing for more precise optimization.
- Device-Specific Analysis: Highlights differences in behavior and performance between mobile, tablet, and desktop users, enabling targeted improvements in user experience.
- Demographic Understanding: Provides insights into the demographics of your organic traffic, helping to tailor content and strategies to better meet the needs of your audience.
- Informed Decision-Making: Supports strategic decisions by revealing which audience segments are most engaged and where there are opportunities for growth.
- Personalized SEO Strategies: Enables the creation of customized strategies for specific user groups based on their behavior and preferences.
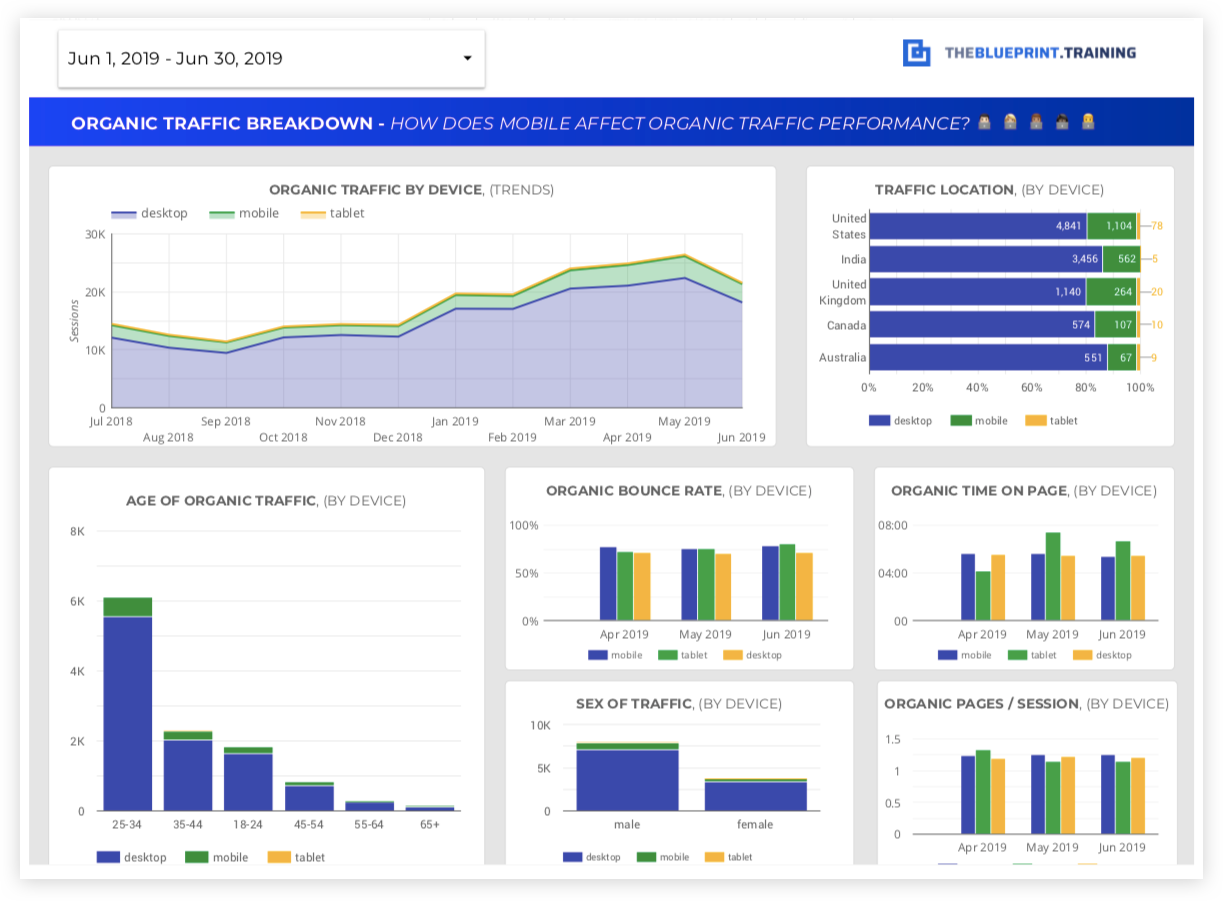
What’s measured on this page?
-
- Organic Traffic Trends by Device: Visual representation of traffic over time, segmented by mobile, desktop, and tablet, to identify patterns and shifts in device usage.
- Traffic by Location and Device Type: Breakdown of organic traffic volume by geographic location and device, highlighting regional preferences and device-specific performance.
- Demographics (Age, Gender) and Device Type: Analysis of traffic by age and gender, segmented by device, to understand which demographic groups are engaging with your site on different platforms.
- Engagement Metrics by Device: Key user behavior metrics like:
- Time on Page: Average duration users spend on your site, segmented by device type.
- Bounce Rate: Percentage of single-page sessions, helping to identify if certain devices have higher exit rates.
- Pages per Session: Average number of pages viewed per visit, offering insights into user journey and engagement levels across different devices.
This level of detail helps identify areas for optimization, ensuring a more targeted and effective SEO strategy tailored to your audience’s needs.
4. Organic landing pages
Why include this page?
- Performance Insight: Identifies which pages are the most and least successful in attracting and retaining organic traffic, reflecting the effectiveness of your SEO efforts.
- Conversion Analysis: Shows which landing pages are not only attracting visitors but also converting them into leads or sales, helping to focus on high-impact content.
- Optimization Opportunities: Highlights pages that may need improvements in content, design, or SEO to better engage users and achieve business goals.
- Content Strategy Guidance: Informs future content creation and optimization by revealing what types of pages and content formats perform best.
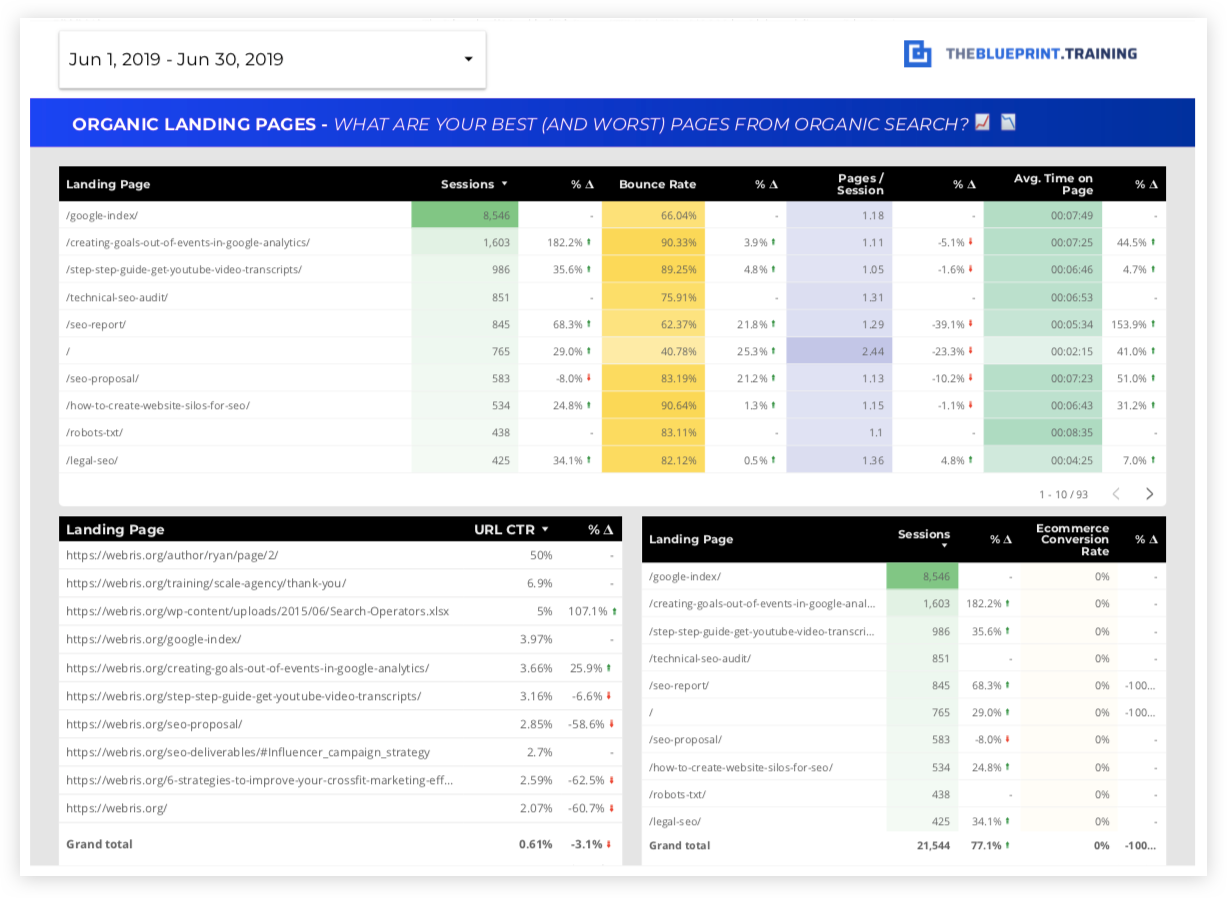
What’s measured on this page?
- Entry Pages from Organic Search: Comprehensive list of all landing pages that users enter through from organic search, along with their:
- Engagement Rates: Metrics like bounce rate, average session duration, and pages per session for each landing page.
- Click-Through Rate (CTR) of Top Landing Pages: Measures how often users click on your page in the search results compared to how often it is shown (impressions), indicating the effectiveness of your titles and meta descriptions.
- Top Sales or Lead-Driving Pages: A list of landing pages generating the highest number of conversions, such as form submissions, product purchases, or other desired actions.
This information helps prioritize SEO efforts towards high-performing pages and improve those that are underperforming, aligning content and SEO strategies with business objectives.
More resources
- N/A
5. Channel comparison
Why include this page?
- Performance Benchmarking: Provides a clear, side-by-side view of how organic search compares to other channels like direct, referral, social, email, and paid traffic, enabling a holistic understanding of overall marketing effectiveness.
- Resource Allocation: Helps determine which channels are delivering the best results, guiding decisions on where to allocate resources and budget for maximum impact.
- Identify Strengths and Weaknesses: Highlights which channels are driving the most traffic, engagement, and conversions, and where there may be opportunities for improvement.
- Strategic Planning: Informs cross-channel strategies by showing how different sources contribute to the customer journey and overall business goals.
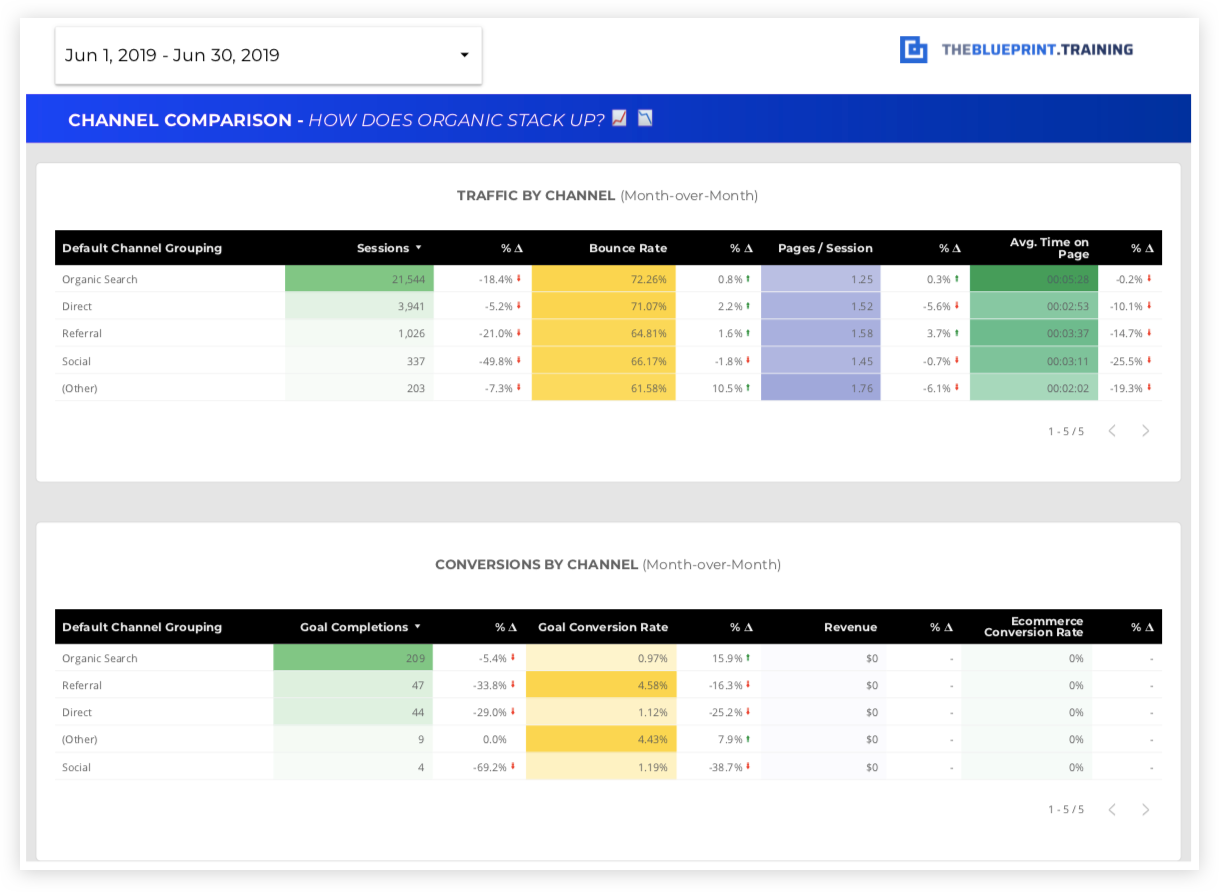
What’s measured on this page?
- Sessions Comparison: Number of sessions (visits) each channel generates, providing an overview of traffic volume and reach for each source.
- Engagement Metrics: Comparison of user behavior across channels, including:
- Bounce Rate: Percentage of single-page sessions, indicating user interest and relevance of content for each channel.
- Pages per Session: Average number of pages viewed per session, showing user engagement and navigation patterns.
- Average Session Duration: Time users spend on the site, reflecting the depth of engagement across channels.
- Conversion Metrics: Evaluation of how well each channel drives conversions, such as sales, leads, or sign-ups, highlighting the channels that most effectively contribute to business goals.
- Channel Performance Trends: Visual representation of how each channel’s performance changes over time, allowing for trend analysis and strategy adjustments.
More resources
- N/A
6. eCommerce conversion and revenue analysis
Why include this page?
- Impact Assessment: Evaluates how effectively organic traffic contributes to your eCommerce sales, providing insights into the ROI of your SEO efforts.
- Performance Comparison: Offers a direct comparison between organic and non-organic traffic, showing which source drives more conversions, revenue, and engagement.
- Strategic Insights: Helps identify high-performing product pages and categories to optimize further, and low-performing areas that may need attention.
- Revenue Optimization: Provides detailed data on metrics like Average Order Value (AOV) and revenue per session, guiding strategies to increase profitability from organic traffic.
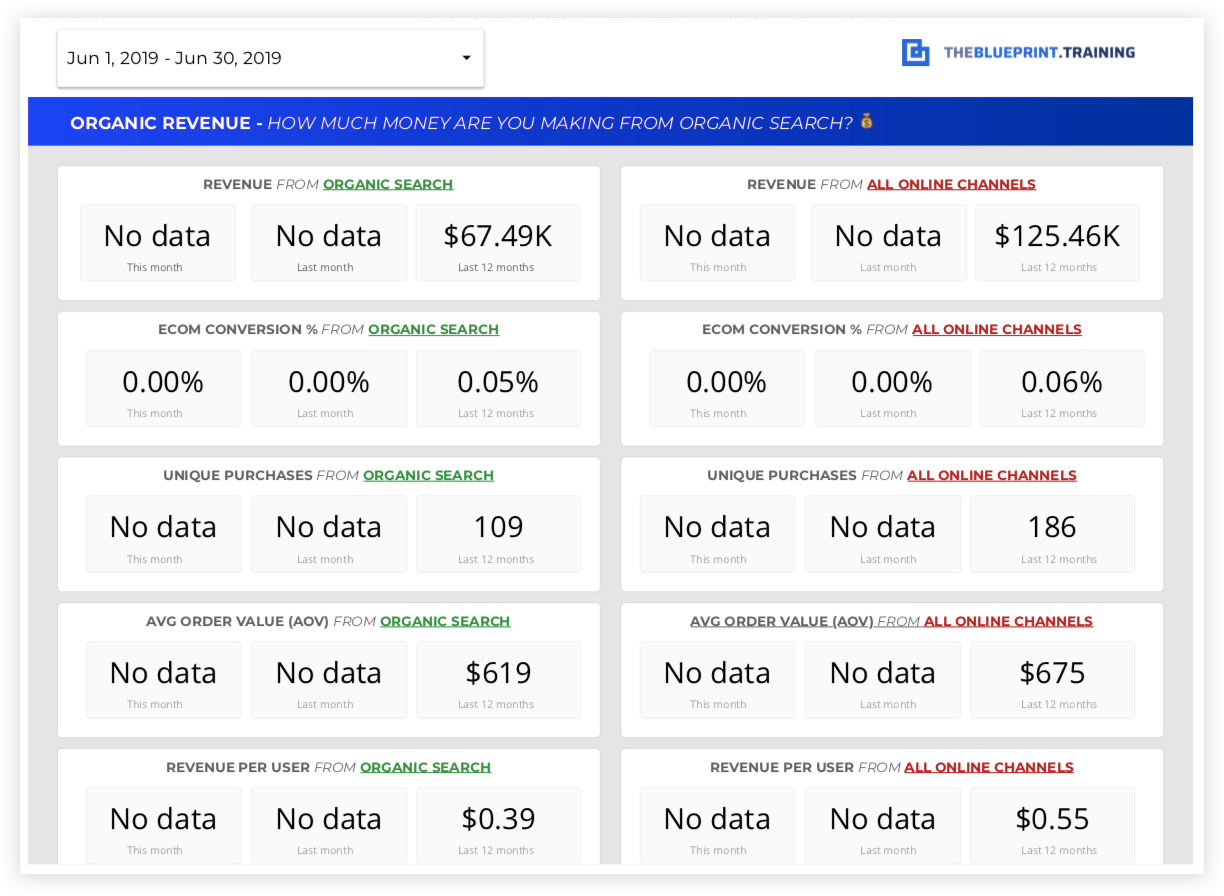
What’s measured on this page?
- Overall eCommerce Conversion Rate:
- Organic vs. Non-Organic Traffic: Comparison of the percentage of sessions resulting in purchases, segmented by organic and other traffic sources.
- Revenue from Organic Search:
- Monthly & Yearly Comparison: Revenue generated from organic search for the current month, previous month, and same month last year, allowing for trend analysis.
- Transactions from Organic Search:
- Monthly & Yearly Comparison: Number of purchases originating from organic search, compared across different time periods to track performance and growth.
- Average Order Value (AOV) from Organic Search:
- Monthly & Yearly Comparison: The average value of orders placed by users arriving through organic search, indicating the quality and spending power of this audience segment.
- Top Organic Landing Pages:
- Sessions & Conversion Rate: A list of landing pages with the highest sessions and conversion rates from organic traffic, compared to the previous reporting period, to identify high-performing pages and areas for improvement.
More resources:
7. Organic revenue report
Why include this page?
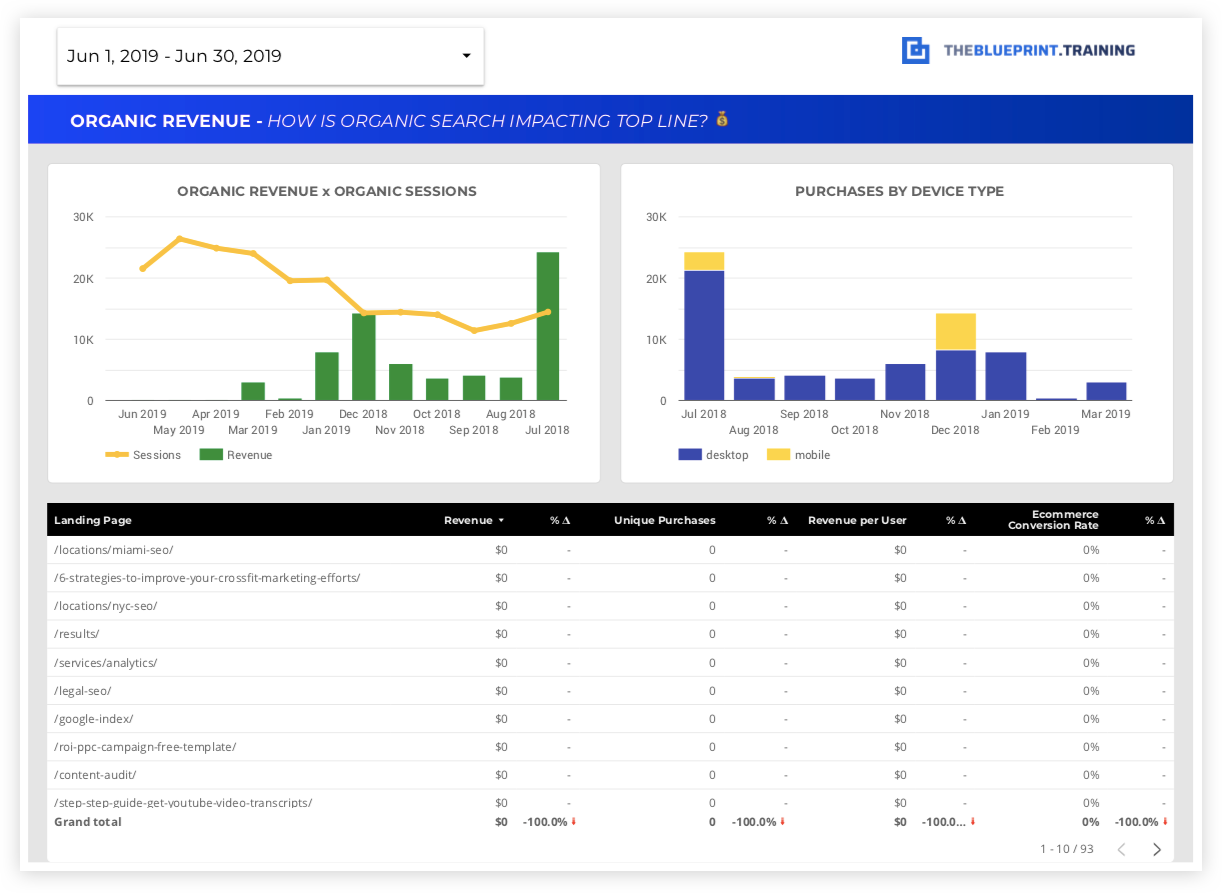
- Revenue Impact Visualization: Provides a clear visual representation of how organic traffic contributes to overall revenue, making it easy to understand trends and patterns.
- Identifies Key Sales Drivers: Highlights which landing pages and device types (mobile vs. desktop) are most effective in generating revenue, enabling targeted optimization efforts.
- Device-Specific Insights: Offers a breakdown of revenue by device type, helping to understand user behavior and optimize for different platforms to maximize sales.
- Informed Strategy Development: Guides eCommerce and SEO strategies by showing which organic channels are most profitable, ensuring focused efforts on high-impact areas.
What’s measured on this page?
- Organic Traffic to Product Revenue Over Time:
- A trend chart illustrating how organic traffic correlates with product revenue over a specific period (e.g., weekly or monthly), helping to visualize peaks, dips, and growth patterns.
- Breakdown of Organic Revenue by Device:
- Comparison of revenue generated from mobile vs. desktop users, providing insights into device performance and areas for improvement in the mobile shopping experience.
- Top Landing Pages Driving Purchases:
- List of key landing pages that lead to purchases, including:
- Revenue per User: Average revenue generated per user for each landing page.
- Conversion Rate: The percentage of sessions on each page that result in purchases, highlighting the effectiveness of different landing pages in driving sales.
- List of key landing pages that lead to purchases, including:
More resources:
8. Organic revenue by demographic
Why include this page?
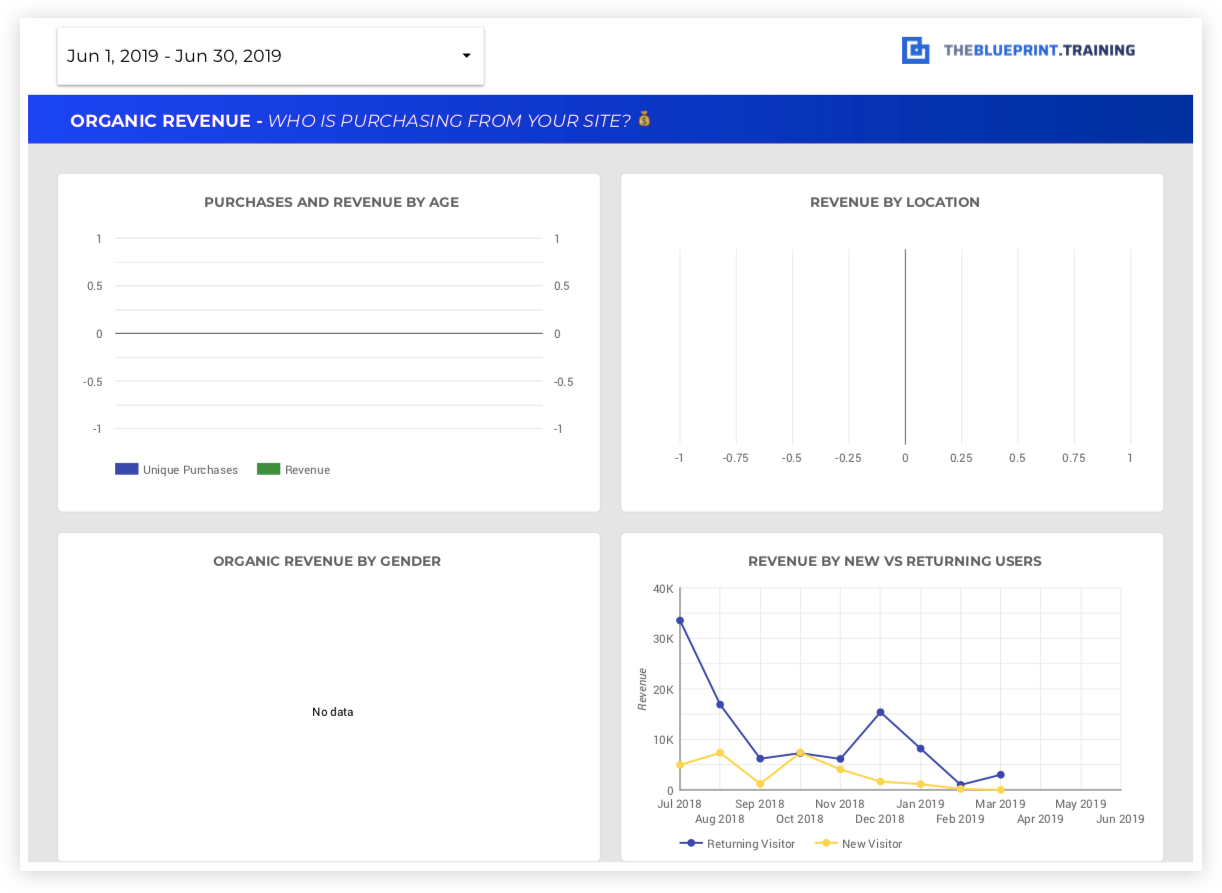
- Customer Insights: Provides a detailed understanding of the demographics of your customers, such as age, gender, and location, helping to tailor marketing and SEO strategies to specific audience segments.
- Targeted Optimization: Identifies which demographic groups are generating the most revenue, enabling targeted content, promotions, and user experience improvements to enhance sales.
- Market Expansion Opportunities: Highlights geographic regions with high revenue potential, guiding decisions on where to focus marketing efforts and expand reach.
- User Loyalty Analysis: Shows the contribution of new versus returning users to overall revenue, offering insights into customer loyalty and the effectiveness of retention strategies.
What’s measured on this page?
- Purchases from Organic Search by Age:
- Breakdown of the number of purchases made by different age groups, revealing which segments are most actively converting and driving sales.
- Revenue by Location (Country):
- Analysis of revenue generated from organic traffic segmented by country, showing which regions contribute most to sales and where there may be growth opportunities.
- Revenue by Gender:
- Revenue contribution segmented by gender, helping to understand gender-specific preferences and tailor product offerings or messaging accordingly.
- Revenue by New vs. Returning Users:
- Comparison of revenue generated from new users versus returning users, providing insights into the effectiveness of your SEO strategies in attracting repeat customers and building brand loyalty.
More resources:
- N/A
9. Lead generation and conversion analysis
Why include this page?
- Focused Conversion Insights: Specifically designed for websites where lead generation is the primary objective, this page evaluates how effectively organic search is driving goal completions, such as form submissions, sign-ups, or downloads.
- Channel Performance Comparison: Provides a clear comparison between organic and non-organic channels, highlighting which source is more effective in converting visitors into leads.
- Conversion Path Optimization: Helps identify high-converting pages and user paths, offering insights into which content and strategies are most successful in driving goal conversions.
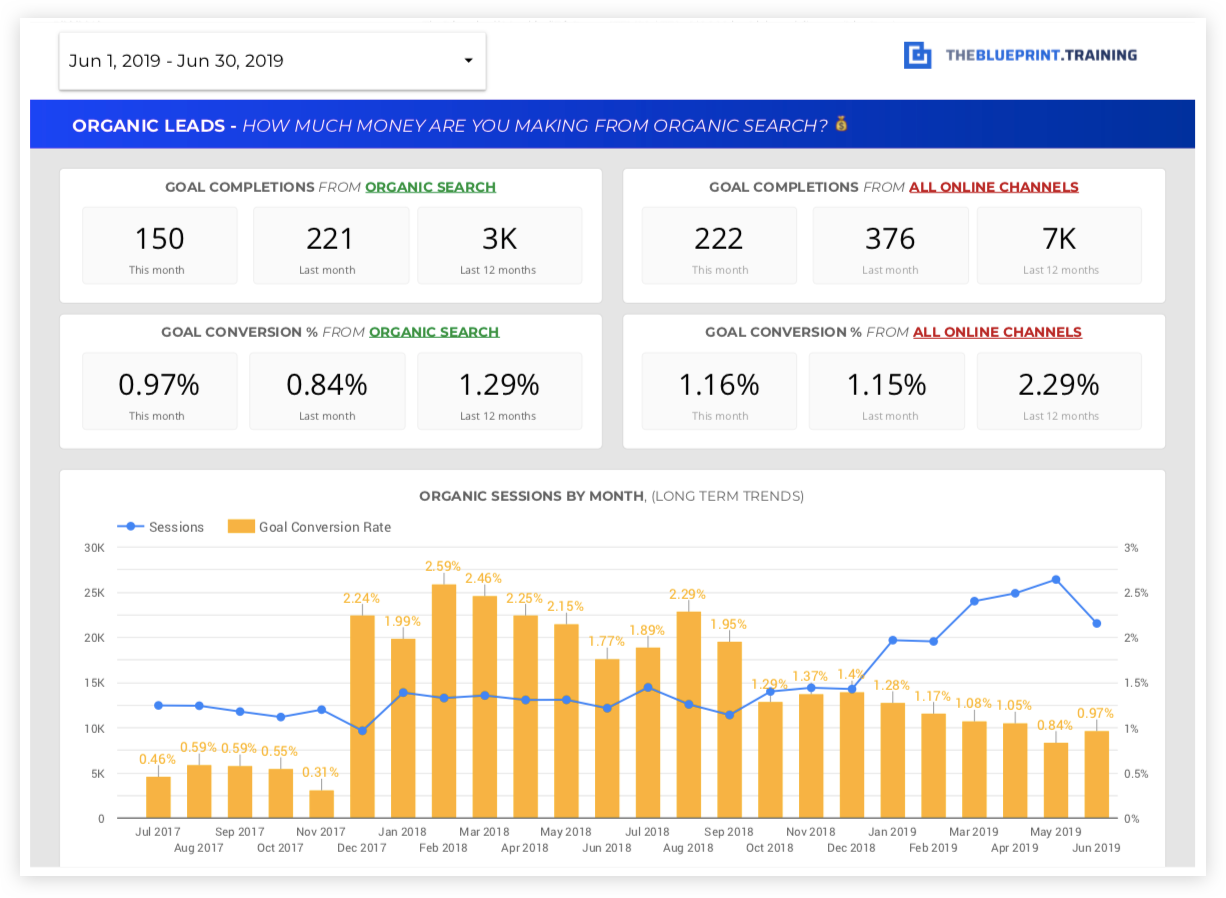
- Long-Term Trend Analysis: Shows the relationship between organic traffic and conversions over time, helping to assess the effectiveness of long-term SEO strategies and identify seasonal trends or patterns.
What’s measured on this page?
- Goal Conversion Rate (Organic Traffic vs. Non-Organic Traffic):
- Comparison of the percentage of sessions resulting in goal completions (e.g., form fills, sign-ups) from organic search versus other channels, providing insights into the effectiveness of SEO efforts in driving leads.
- Total Number of Goal Conversions (Organic Traffic vs. Non-Organic Traffic):
- Total count of goal completions from organic traffic compared to non-organic channels, illustrating which source contributes more to overall lead generation.
- Organic Traffic vs. Organic Conversions Over a Long Trend Period:
- A visual trend line showing the correlation between organic traffic volume and goal conversions over an extended period, helping to identify patterns, assess the impact of SEO changes, and measure long-term performance.
10. Lead generation by entry page
Why include this page?
- Impact Analysis: Offers a detailed look at how the most visited entry pages are contributing to your lead generation efforts, helping to identify which pages are most effective in driving conversions.
- Optimization Opportunities: Highlights pages with high traffic but low conversion rates, indicating areas where content or user experience improvements could lead to better results.
- Strategic Content Planning: Provides insights into the types of content or page layouts that are resonating with users and generating leads, guiding future content development and optimization efforts.
- Enhanced User Experience: By understanding user behavior on key landing pages, you can refine the user journey to reduce bounce rates and increase engagement, ultimately improving conversion rates.

What’s measured on this page?
- Goal Completions: The total number of goal completions (e.g., form submissions, sign-ups) for each landing page, showing which pages are driving the most leads.
- Goal Conversion Rate: The percentage of sessions on each landing page that result in a goal completion, indicating the effectiveness of each page in converting visitors into leads.
- Bounce Rate: The percentage of single-page sessions on each landing page, helping to identify pages that may not be meeting user expectations or require optimization to reduce exits.
- Pages per Session: The average number of pages viewed during a session starting from each landing page, reflecting user engagement and navigation patterns.
- Average Time on Page: The average duration users spend on each landing page, providing insights into how effectively the content captures and retains user interest.
More resources:
- N/A
11. Organic leads by demographic
Why include this page?
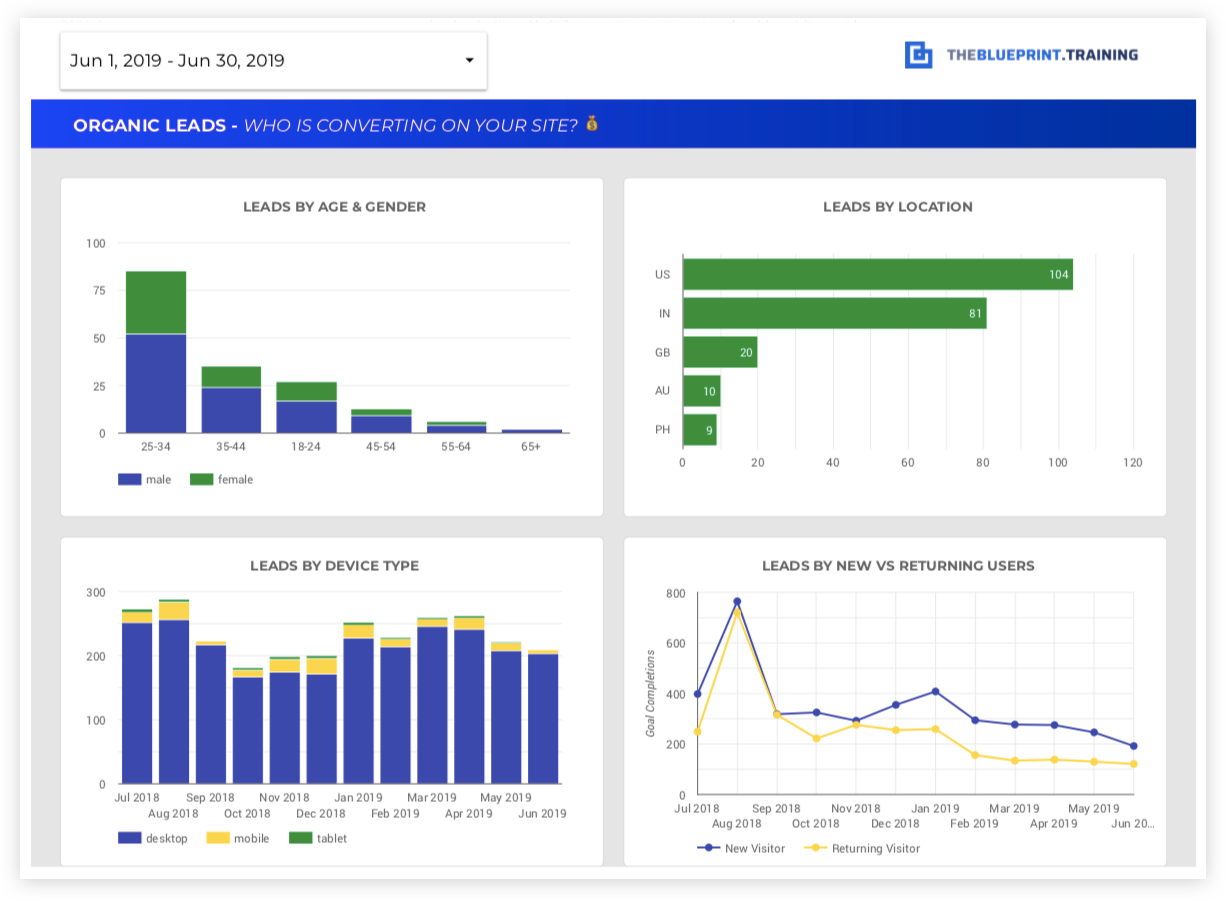
- Targeted Marketing Insights: Breaks down the demographics of your website’s leads from organic traffic, offering valuable information for tailoring marketing strategies and content to specific audience segments.
- Conversion Analysis: Helps you understand which demographic groups are most likely to convert, enabling focused efforts to optimize user experience and messaging for these segments.
- Market Segmentation: Provides a clear picture of lead generation performance across different demographic groups, helping to identify high-potential markets and areas for improvement.
What’s measured on this page?
- Leads from Organic Search by Age: Number of leads generated from organic traffic segmented by age group, showing which age ranges are most engaged and likely to convert.
- Leads by Location (Country): Geographic breakdown of leads, indicating which regions are most responsive to your SEO efforts and where there may be opportunities for localized marketing strategies.
- Leads by Gender: Analysis of leads segmented by gender, offering insights into gender-specific behaviors and preferences.
- Leads by New vs. Returning Users: Comparison of leads generated from first-time visitors versus returning users, providing insights into user loyalty and the effectiveness of your lead nurturing strategies.
More resources:
- N/A
12. Local SEO reporting breakdown
Why include this page?
- Local Market Performance: Offers insights into how well your business is performing in local search, essential for businesses with a physical presence or service area.
- Optimizes Local Strategy: Helps fine-tune local SEO efforts by tracking performance metrics specific to your local landing pages and Google My Business (GMB) profile.
- Geo-Specific Targeting: Shows how effectively your website is capturing local traffic and converting it into leads or sales, supporting more focused and effective local marketing strategies.
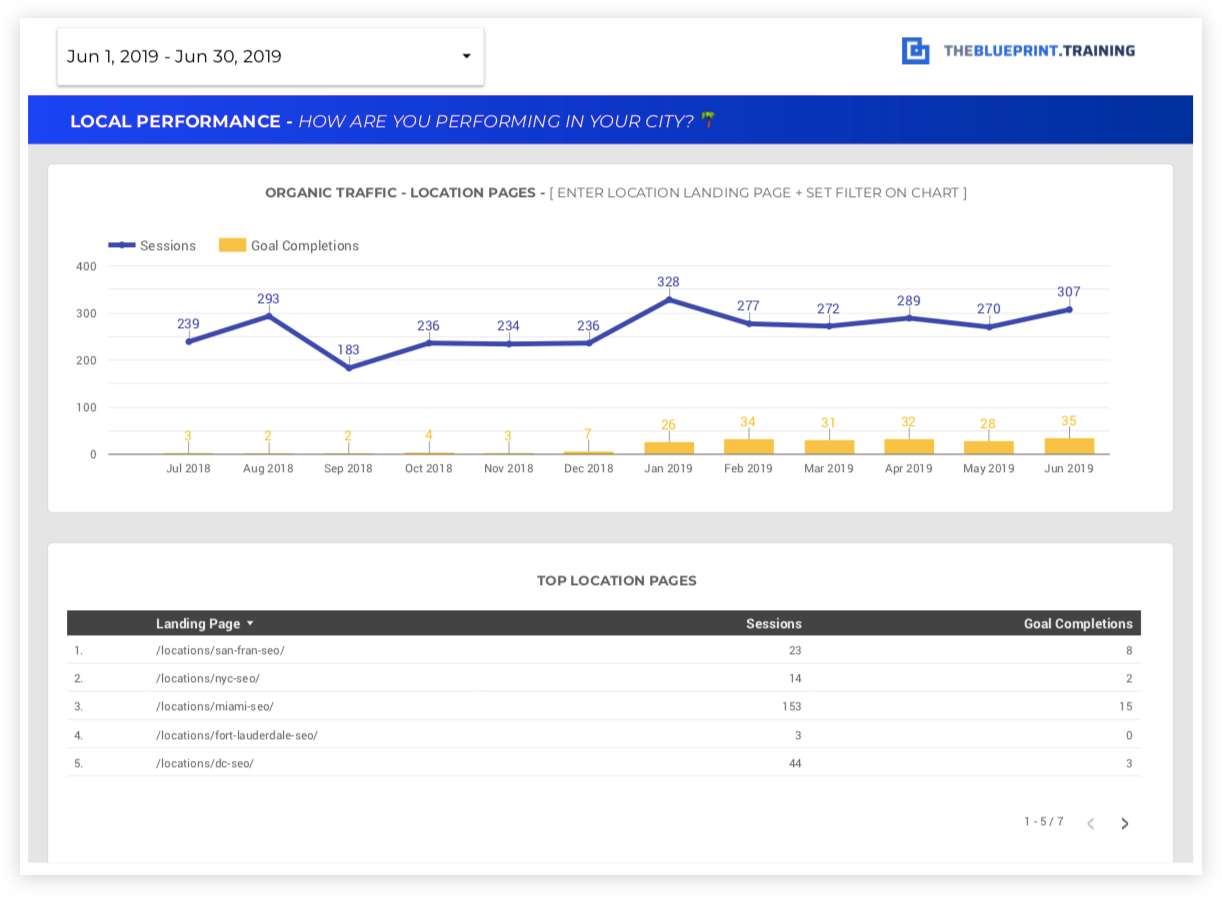
What’s measured on this page?
- Trend of Organic Traffic vs. Goal Completions on Local Landing Pages: Tracks the relationship between organic visits and goal completions (e.g., form submissions, calls) on your local pages, showing the effectiveness of your local SEO efforts.
- Goal Conversion Rate for Local Pages: Conversion rate for local pages, highlighting how well these pages turn local traffic into customers or leads.
- List of Local Landing Pages Organic Performance: A comprehensive view of each local landing page’s performance in terms of traffic, conversions, and other key metrics, helping to identify top-performing pages and areas for improvement.
More resources:
13. Keyword visibility progression
Why include this page?
- Track Keyword Success: Monitors how your keyword rankings in the top 3 positions have changed since the start of your SEO campaign, providing a clear measure of progress.
- Overall Ranking Trends: Helps visualize your overall keyword performance and search visibility over time, using data from Google Search Console.
- Campaign Effectiveness: Demonstrates the effectiveness of your SEO efforts by tracking keyword growth and visibility, supporting strategic adjustments and goal setting.
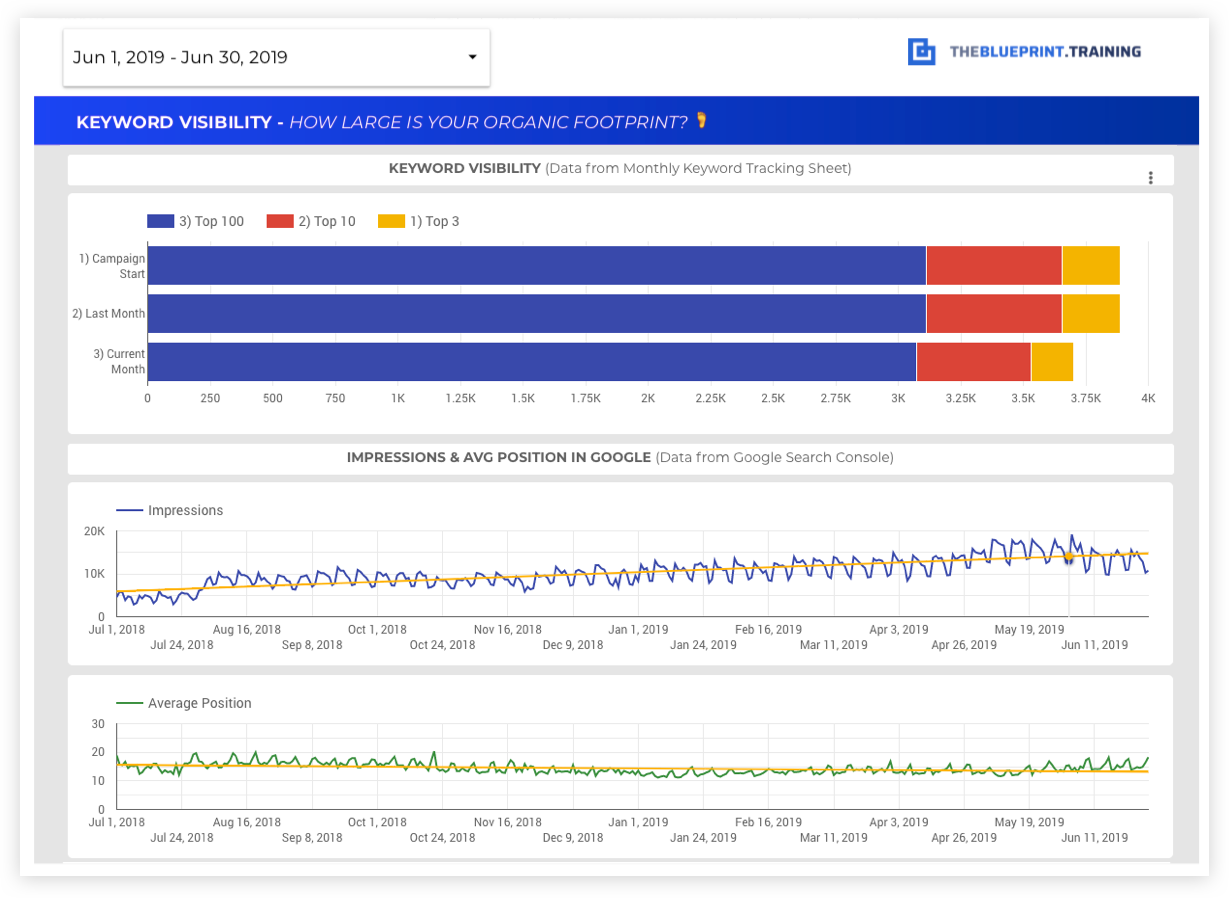
What’s measured on this page?
- Number of Keywords in Top 3 Positions: Tracks the count of keywords ranking in the top 3 positions on Google for the current month, last month, and since the campaign started, showing how visibility has improved over time.
- Average Position Over Time: Shows the average ranking position of your website’s keywords in Google over a specified period, highlighting overall SEO performance trends.
- Impressions Over Time: Measures the number of impressions (times your website appears in search results) over time, indicating how often your site is being seen by potential visitors.
More resources:
14. Keyword performance report
Why include this page?
- Search Query Insights: Provides detailed data on the exact search queries driving traffic to your website, helping to understand what users are searching for and how they find your site.
- Non-Branded Keyword Trends: Tracks the performance of non-branded keywords (those without your brand name), which typically indicate commercial intent and are critical for attracting new customers.
- Optimization Guidance: Informs content and SEO strategy adjustments by showing keyword trends and traffic patterns over time, guiding efforts to improve rankings and traffic.
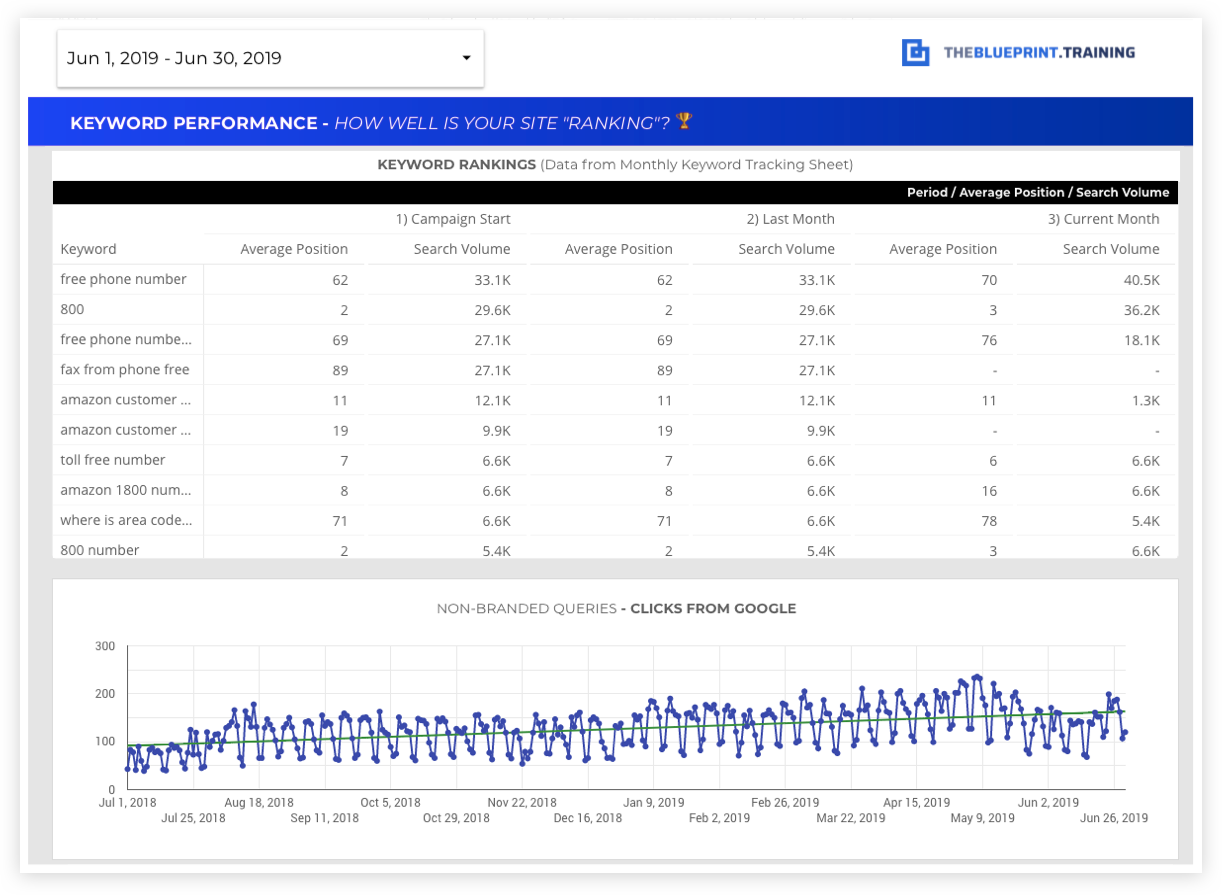
What’s measured on this page?
- Search Queries Driving Traffic: Lists the specific keywords and search phrases users are using to find your website, highlighting which terms are most effective in attracting visitors.
- Top Keyword Rankings (Current vs. Previous): Tracks the ranking positions of your top keywords, comparing their performance this month versus the previous month and campaign start.
- Traffic from Non-Branded Keywords: Monitors how traffic from non-branded (commercial intent) queries is trending over the course of your campaign, indicating how well you are capturing new audiences.
More resources:
- N/A
15. Links and content published
Why include this page?
- SEO Growth Drivers: Demonstrates the impact of link building and content creation on your SEO performance, two key elements in driving search visibility and authority.
- Campaign Accountability: Provides a transparent view of the number of backlinks acquired and content pieces published during the reporting period, allowing for better tracking of SEO activities and efforts.
- Customizable Reporting: This page can be tailored to fit your specific reporting needs, showcasing the progress and effectiveness of your link-building and content strategies.
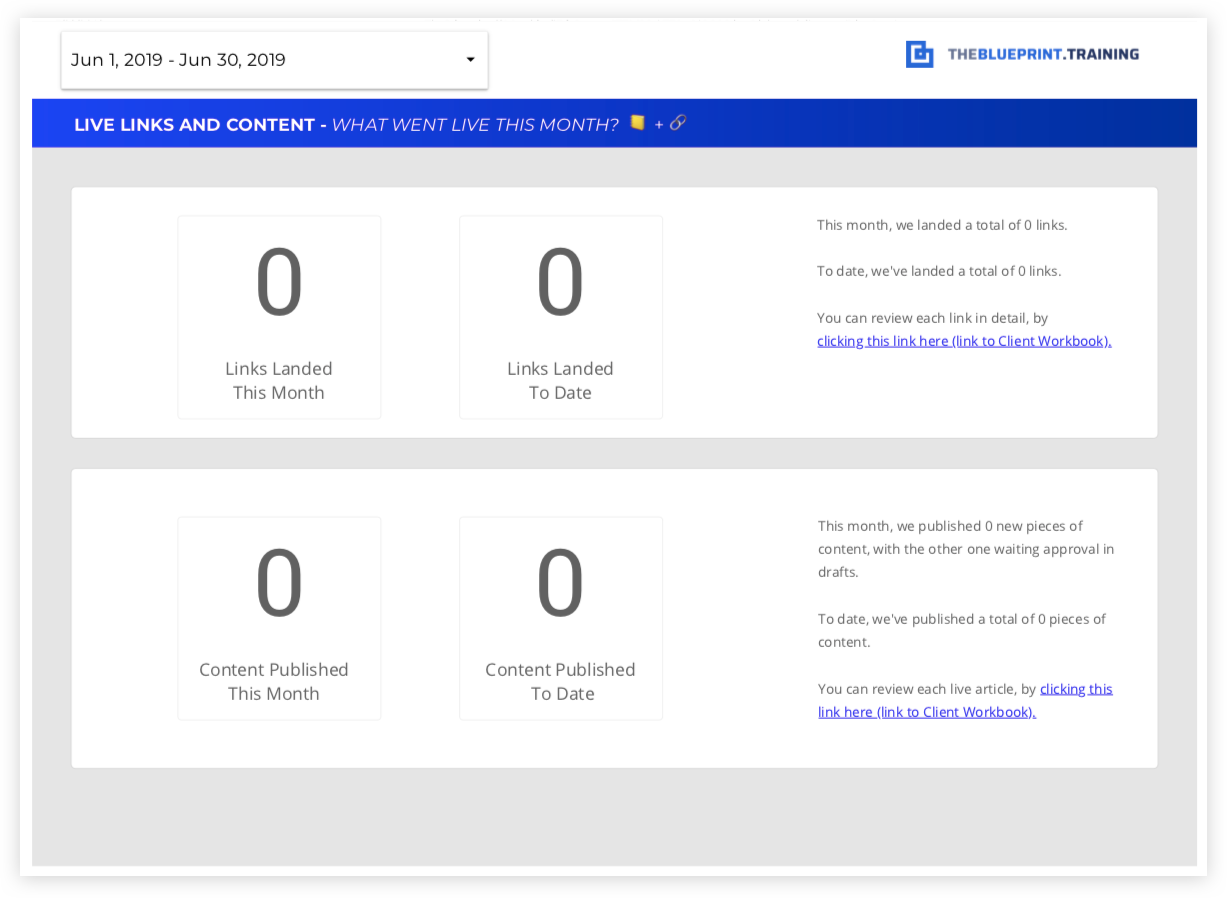
What’s measured on this page?
- Links Landed This Month: Number of backlinks acquired during the current reporting month, reflecting the success of your link-building efforts.
- Total Links Landed to Date: Cumulative number of backlinks gained since the start of your campaign, showing long-term progress in link-building.
- Articles Published This Month: Number of new articles or content pieces published during the reporting month, indicating content creation activity.
- Total Articles Published to Date: Cumulative count of all content pieces published over the course of the campaign, highlighting overall content output and strategy.
Wrapping it up
Did we miss anything? What else would like to see out of our reporting template?