

Most agency reports answer the wrong question.
Rankings, impressions, traffic. All true. None of it tells the client what they're paying you to find out: how many customers did we get, and what did each one cost?
What should an agency client report include? Four layers: visibility, response, quality and outcome, ending with how many new customers the client got and what each one cost. Rankings and traffic are where the report starts, not where it ends.
A lot of SEOs avoid that conversation. Talking about leads means opening the CRM, and if the leads aren't there, you're fired.
Sell paid search and you don't get to avoid it anymore. Good news: clients love it. Talking about their numbers shows them you're on top of the account.
Here's the short version:
- Report four layers: visibility, response, quality, outcome. Most reports stop at the first one.
- The number that matters is cost per customer, against the target the client gave you.
- Set up tracking before the first report: GA4, Search Console, call tracking, and conversion tracking on every intake path.
- Start reporting on the discovery call. Ask how their last agency measured success.
- Give clients a live dashboard they can open any day, and a short monthly summary on top.
What most reports show
- ✕Rankings
- ✕Sessions and impressions
- ✕40 pages of charts
What the client wants
- ✓How many customers
- ✓What each one cost
- ✓Against their target
Why Most Agency Reports Get Ignored
Because they report the channel, not the business.
A 40-page PDF of rankings and sessions looks like work. But the owner flips to the end looking for one thing: did the phone ring, and did it pay?
If the report can't answer that, the client answers it themselves. Usually by cancelling.
The Four Layers of a Client Report
Measure the business, not just the dashboards. Every client report should move through four layers, in order.
1. Visibility
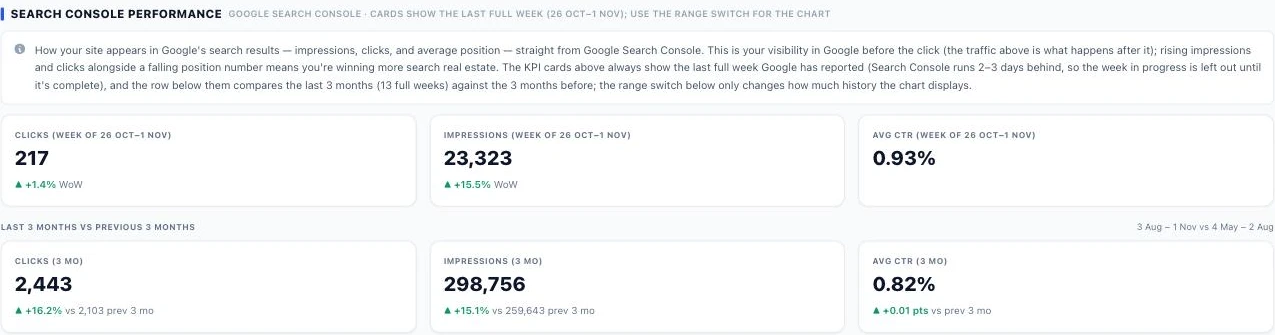
Are they showing up for the right services and locations? Rankings, the map pack, AI citations, ad impressions.
It's where you start, not where you stop. Report it as the leading indicator it is.
2. Response
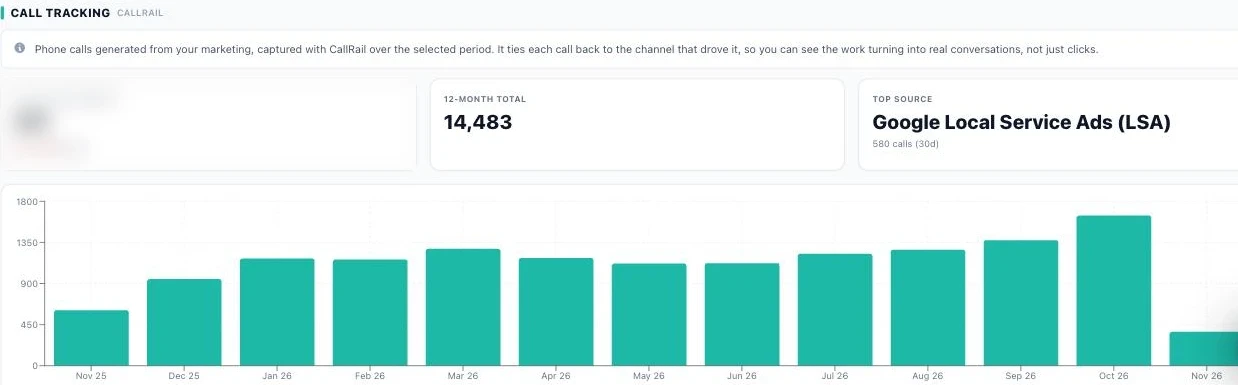
How many calls, forms and messages are coming in? This is where call tracking earns its keep.
For most local businesses the phone is the main intake path. If you only count form fills, you're missing most of the leads.
3. Quality
How many of those are real opportunities, and how many book?
This is the number that tells you if intake is working. Great marketing into a phone nobody answers still looks like bad marketing in the report.
| Stage | What to count | What it tells you |
|---|---|---|
| Leads | Every call, form and message | Is the marketing working? |
| Qualified | Real opportunities, not spam or wrong service | Is the targeting right? |
| Booked | Consults, estimates or appointments set | Is intake working? |
4. Outcome: Cost per Customer
New customers, and what it cost to get each one. Report cost per customer, not just cost per lead.
Most clients already know what they can afford to pay for a customer. Put that target next to your number every month.
Here's a real example from one of our paid search forecasts: $5,000 in spend, 62 leads, a 15% close rate, 9.2 new clients at $541 each, against an $800 target. The full math is in how to build a PPC proposal.
Count Each Customer Once
When you run more than one channel, report the combined result.
Don't count the same customer twice because they saw an ad and then found the business on Maps. Total customers and blended cost per customer go first. The channel breakdown goes underneath.
| Report line | Example |
|---|---|
| Total new customers | Counted once, from the CRM |
| Blended cost per customer | All spend + fees ÷ total customers |
| Channel breakdown | Underneath, for context |
Set Up Tracking Before Your First Report
You can't report on the business if you can't see it. Analytics is the first workstream in every campaign we run, before anything else:
- Google Analytics 4 and Search Console, set up properly and auditable.
- Key events in GA4 for every lead action. Google renamed GA4 "conversions" to "key events." "Conversions" now means the ones shared with Google Ads for bidding (Google Analytics Help, checked Nov 7, 2026).
- Call tracking on every client, with CallRail or WhatConverts.
- Conversion tracking on every intake path, forms and chat included.
- A dashboard the client can open any day.
That's the analytics workstream in our standard scope. The full scope is in how to write an SEO proposal.
- ✓GA4 + Search ConsoleSet up and auditable
- ✓Key eventsEvery lead action marked
- ✓Call trackingCallRail or WhatConverts
- ✓Every intake pathForms and chat included
- ✓Live dashboardThe client can open it any day
Start Reporting on the Discovery Call
Reporting starts before you're hired. On the discovery call, ask about their last agency:
- What worked? What didn't?
- How did you measure that success?
- Were you getting reports? Did you read them?
If the answer is "we never saw anything," that's your opening. Cover analytics in detail on the proposal call.
Then get the numbers you'll be measured on: what a new customer is worth, what percentage of leads they close, and who answers the calls. More on that call in how to sell SEO services.
- ?What worked? What didn’t?With their last agency
- ?How did you measure success?Their answer is your opening
- ?What’s a customer worth?Sets the target
- ?Who answers the calls?Fix intake before launch
What to Put in a Monthly Client Report (Template)
Keep the monthly report short. The dashboard holds the detail. The report tells the story.
Use these five sections, in this order:
- The headline number. New customers and cost per customer, against their target.
- The four layers. One line each: visibility, response, quality, outcome.
- What we did. The work shipped this month, in plain language.
- What's next. Next month's priorities, tied to the numbers.
- What we need from you. Approvals, access, or intake fixes.
If you only report SEO, here's our SEO report template for the visibility layer.
| # | Section | What goes in it |
|---|---|---|
| 1 | The headline number | New customers and cost per customer vs. target |
| 2 | The four layers | One line each |
| 3 | What we did | Work shipped, in plain language |
| 4 | What’s next | Priorities tied to the numbers |
| 5 | What we need from you | Approvals, access, intake fixes |
Live Dashboards vs. Monthly Reports
Do both. A live dashboard lets the client check their numbers any day. The monthly summary tells them what the numbers mean.
Clients who can see their numbers ask fewer "what are you doing?" questions. And the ones who never log in still know they could.
Monthly PDF only
- ✕Client waits a month
- ✕"What are you doing?" emails
- ✕Numbers without context
Live dashboard + monthly summary
- ✓Numbers any day
- ✓Fewer status questions
- ✓The summary explains them
Client Reporting Tools Compared
Prices and features checked on each vendor's pricing page, Nov 7, 2026.
| Tool | Price (checked Nov 7, 2026) | Pricing model |
|---|---|---|
| Agency OS | $199/mo | Included with Blueprint membership |
| AgencyAnalytics | $20 per client / mo | Per client, billed annually |
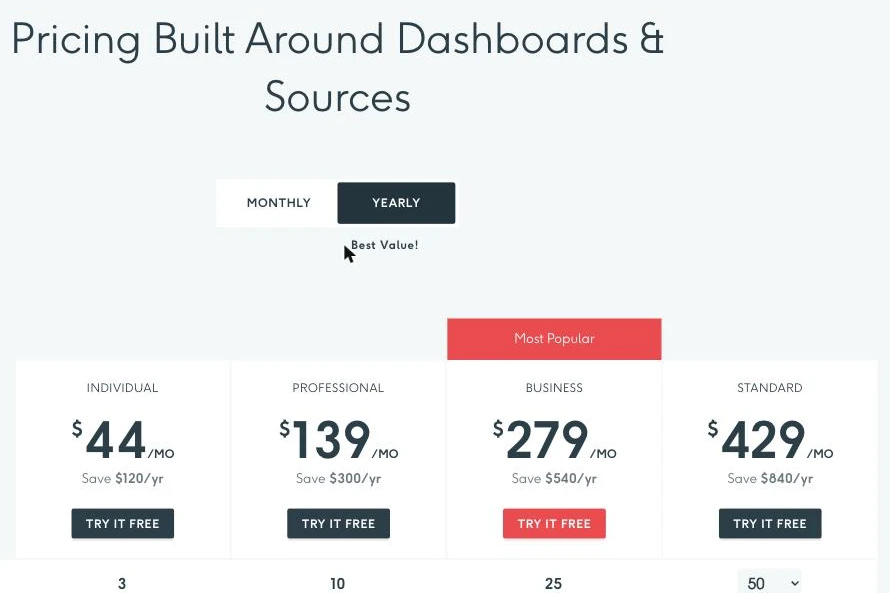
| DashThis | From $44/mo | Per dashboard and source, billed yearly |
| Google Data Studio | Free (Pro $9/user/project/mo) | You build it yourself |
Agency OS
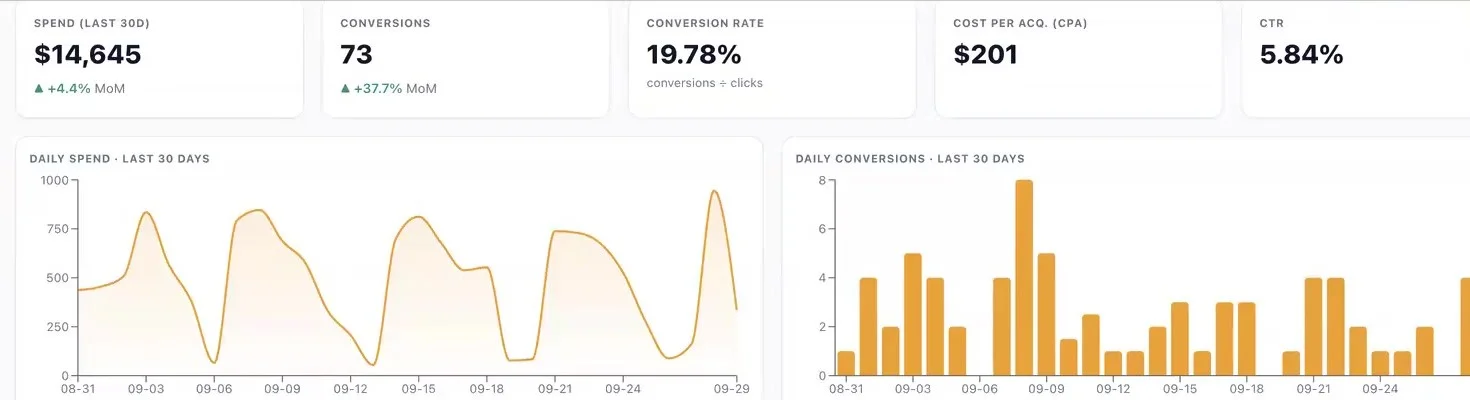
Reporting lives in the same place as the pipeline, projects and proposals. Connect the client's data sources at onboarding and the SEO, PPC, LSA and Meta dashboards fill in.
It pulls Search Console, GA4 key events, Google Business Profile, keyword rankings, AI referral traffic, call tracking, Google Ads and Local Service Ads. Clients see it live in their portal.
Setup: connecting a client's data sources and sharing a client report. More in Agency OS.
AgencyAnalytics
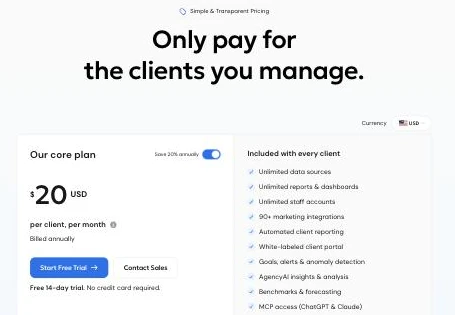
Priced per client: $20 per client per month, billed annually, with a 14-day free trial.
Every client includes unlimited reports and dashboards, 90+ integrations, a white-labeled client portal and MCP access for ChatGPT and Claude. Rank tracking is an add-on ($41.67/mo per 500 keywords, billed annually).
Source: AgencyAnalytics pricing, checked Nov 7, 2026.
DashThis
Priced by dashboards and data sources, billed yearly: Individual $44/mo (3 dashboards, 15 sources), Professional $139/mo (10 dashboards), Business $279/mo (25 dashboards) and Standard $429/mo (50 dashboards).
Every plan includes unlimited users and integrations. Most agencies build one dashboard per client.
Source: DashThis pricing, checked Nov 7, 2026.
Google Data Studio (Formerly Looker Studio)
Google renamed Looker Studio back to Data Studio. It's free for report creators and viewers. Data Studio Pro costs $9 per user per project per month.
It connects to Google Ads, GA4, Sheets and BigQuery natively. The cost is your time: you build every report, and you fix it when a connector breaks.
Source: Google Cloud, Data Studio, checked Nov 7, 2026.
| Plan | Price | What you get |
|---|---|---|
| Data Studio | No charge | Self-service reports, native Google connectors |
| Data Studio Pro | $9 per user per project / mo | Team content management and Google Cloud support |
Which Tool Should You Use?
- Just starting, one or two clients: Data Studio. Free, and you'll learn what you actually need.
- You want polished white-label reports and nothing else: AgencyAnalytics or DashThis.
- You want reporting tied to the pipeline, projects and proposals: Agency OS.
Picking a CRM at the same time? Here's the best CRM for marketing agencies.
| If you… | Use |
|---|---|
| Have one or two clients and no budget | Google Data Studio |
| Want polished white-label reports only | AgencyAnalytics or DashThis |
| Want reporting tied to pipeline, projects and proposals | Agency OS |
Client Reporting Mistakes
- ❌ Stopping at visibility. Traffic and rankings can climb while the phone stays quiet.
- ❌ Reporting the channel instead of the business. The client cares how many customers came in and what they cost.
- ❌ No call tracking. You miss most of the leads for a local business.
- ❌ Counting the same customer twice across channels.
- ❌ A 40-page PDF nobody reads.
- ❌ Pricing on numbers you can't see. If you get paid per lead or on revenue, you need attribution you can audit. More in SEO pricing models.
- ✕Stopping at visibility
- ✕Reporting the channel
- ✕No call tracking
- ✕Counting customers twice
- ✕A 40-page PDF
- ✕Pricing on numbers you can’t see
Client Reporting FAQs
What should an agency client report include? Four layers: visibility for the right services and locations, the calls, forms and messages coming in, how many are qualified and booked, and how many become customers at what cost.
What's the most important metric in a client report? Cost per customer. Clients usually know what they can afford to pay for a new customer, so it's the number that tells them if the work is paying off.
What tracking does an agency need before reporting? GA4 and Search Console set up properly, key events for every lead action, call tracking such as CallRail or WhatConverts, conversion tracking on every intake path, and a live dashboard.
How often should agencies send client reports? Give clients a live dashboard they can check any day, plus a short monthly summary that explains the numbers and what's next.
What's the best client reporting tool for agencies? It depends on what you need. Google Data Studio is free if you build reports yourself. AgencyAnalytics ($20 per client per month, billed annually) and DashThis (from $44/mo) handle white-label reporting. Agency OS ties reporting to your pipeline, projects and proposals.
Should clients see live reporting? Yes. A client portal lets them check their numbers any day, and it shows them you're on top of the account.
Report on Customers, Not Clicks
Blueprint members get Agency OS with SEO, PPC and LSA reporting and a live client portal, plus the full sales and paid search training.
Join The Blueprint Training →